Posts Tagged: visualization
Paper: Perspectives on the 2×2 Matrix

Hansjörg Neth, Nico Gradwohl, Dirk Streeb, Daniel A. Keim, Wolfgang Gaissmaier
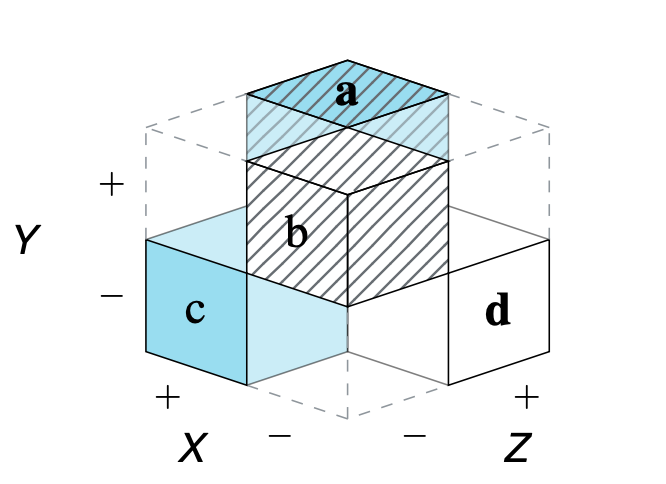
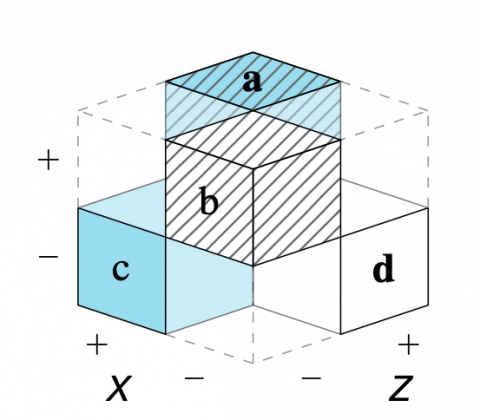
Perspectives on the 2×2 matrix: Solving semantically distinct problems based on a shared structure of binary contingencies
Abstract
Cognition is both empowered and limited by representations. The matrix lens model explicates tasks that are based on frequency counts, conditional probabilities, and binary contingencies in a general fashion. Based on a structural analysis of such perspective on representational accounts of cognition that recognizes representational isomorphs as opportunities, rather than as problems.
The shared structural construct of a 2×2 matrix supports a set of generic tasks and semantic mappings that provide a tasks, the model links several problems and semantic domains and provides a new unifying framework for understanding problems and defining scientific measures. Our model’s key explanatory mechanism is the adoption of particular perspectives on a 2×2 matrix that categorizes the frequency counts of cases by some condition, treatment, risk, or outcome factor. By the selective steps of filtering, framing, and focusing on specific aspects, the measures used in various semantic domains negotiate distinct trade-offs between abstraction and specialization. As a consequence, the transparent communication of such measures must explicate the perspectives encapsulated in their derivation.
To demonstrate the explanatory scope of our model, we use it to clarify theoretical debates on biases and facilitation effects in Bayesian reasoning and to integrate the scientific measures from various semantic domains within a unifying framework. A better understanding of problem structures, representational transparency, and the role of perspectives in the scientific process yields both theoretical insights and practical applications.
Why read this paper?
This paper is quite long and covers a wide array of concepts and topics. So what can you expect to gain from reading it?


riskyr: A toolbox for rendering risk literacy more transparent
so as to make the solution transparent.
Hansjörg Neth, Felix Gaisbauer, Nico Gradwohl, Wolfgang Gaissmaier
riskyr: A toolbox for rendering risk literacy more transparent
Abstract: Risk-related information — like the prevalence of conditions and the sensitivity and specificity of diagnostic tests or treatment decisions — can be expressed in terms of probabilities or frequencies. By providing a toolbox of methods and metrics, the R package riskyr computes, translates, and displays risk-related information in a variety of ways. Offering multiple complementary perspectives on the interplay between key parameters renders teaching and training of risk literacy more transparent.
Paper: FFTrees: An R toolbox to create, visualize, and evaluate FFTs
is nevertheless totally incomprehensible to a human expert, can it
be described as knowledge? Under the common-sense definition of this term
as material that might be assimilated and used by human beings, it is not…
Nathaniel Phillips, Hansjörg Neth, Jan Woike, Wolfgang Gaissmaier
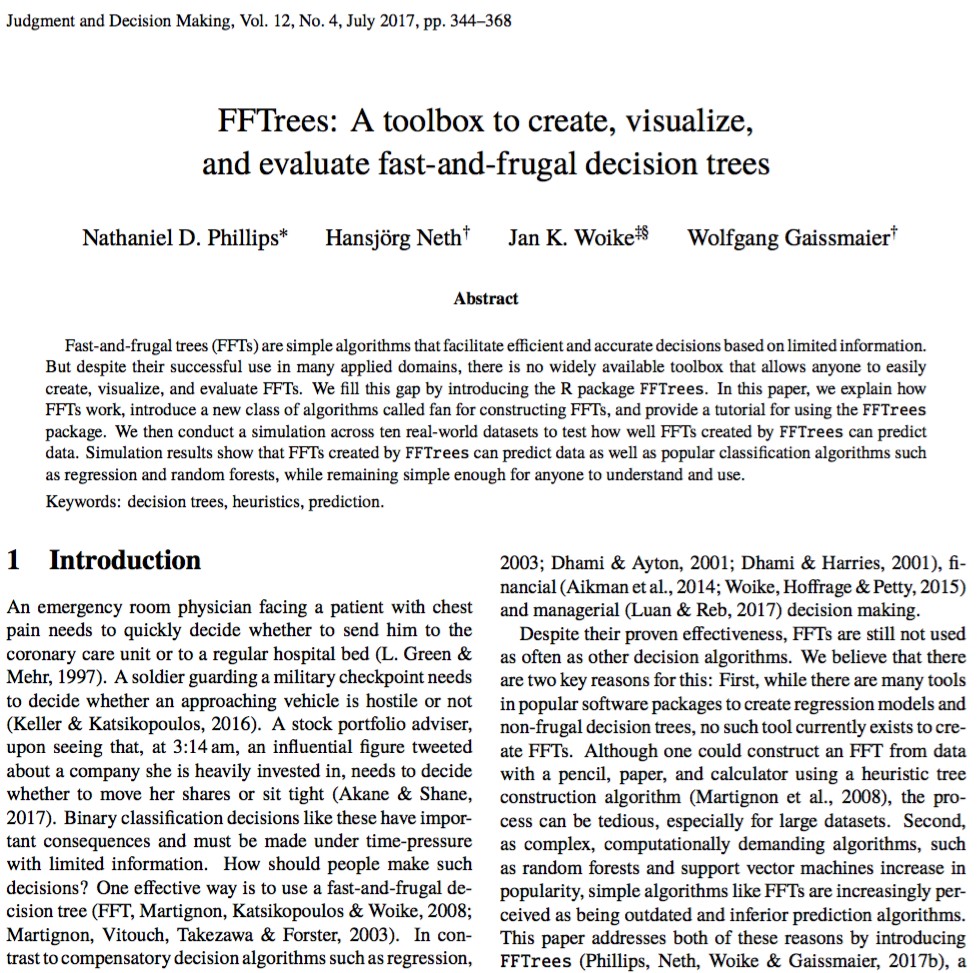
FFTrees: A toolbox to create, visualize, and evaluate fast-and-frugal decision trees
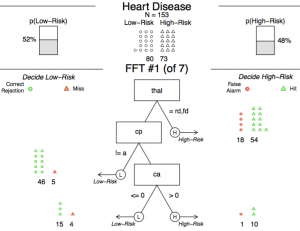
An example of an FFT predicting the risk of having heart disease.
Abstract: Fast-and-frugal trees (FFTs) are simple algorithms that facilitate efficient and accurate decisions based on limited information. But despite their successful use in many applied domains, there is no widely available toolbox that allows anyone to easily create, visualize, and evaluate FFTs. We fill this gap by introducing the R package FFTrees.