Paper: Perspectives on the 2×2 Matrix
Hansjörg Neth, Nico Gradwohl, Dirk Streeb, Daniel A. Keim, Wolfgang Gaissmaier
Perspectives on the 2×2 matrix: Solving semantically distinct problems based on a shared structure of binary contingencies
Abstract
Cognition is both empowered and limited by representations. The matrix lens model explicates tasks that are based on frequency counts, conditional probabilities, and binary contingencies in a general fashion. Based on a structural analysis of such perspective on representational accounts of cognition that recognizes representational isomorphs as opportunities, rather than as problems.
The shared structural construct of a 2×2 matrix supports a set of generic tasks and semantic mappings that provide a tasks, the model links several problems and semantic domains and provides a new unifying framework for understanding problems and defining scientific measures. Our model’s key explanatory mechanism is the adoption of particular perspectives on a 2×2 matrix that categorizes the frequency counts of cases by some condition, treatment, risk, or outcome factor. By the selective steps of filtering, framing, and focusing on specific aspects, the measures used in various semantic domains negotiate distinct trade-offs between abstraction and specialization. As a consequence, the transparent communication of such measures must explicate the perspectives encapsulated in their derivation.
To demonstrate the explanatory scope of our model, we use it to clarify theoretical debates on biases and facilitation effects in Bayesian reasoning and to integrate the scientific measures from various semantic domains within a unifying framework. A better understanding of problem structures, representational transparency, and the role of perspectives in the scientific process yields both theoretical insights and practical applications.
Why read this paper?
This paper is quite long and covers a wide array of concepts and topics. So what can you expect to gain from reading it?
The article introduces two abstract frameworks for analyzing problems based on binary contingencies: A general matrix lens model (see Figure 2) and a more specific partial cube model (see Figure 5). Together, these models explain a wide range of phenomena on the basis of adopting particular perspectives on the simple representational construct of a 2×2 matrix (aka. contingency table or confusion matrix).
The basic idea behind both models is that the 2×2 matrix acts as a lens that converts information into insight (e.g., frequency counts into scientific metrics that express conditional probabilities). The key mechanism that explains the measures is the adoption of particular perspectives on a framed matrix. The structure and interpretation of any contingency matrix is based on semantic constraints (e.g., how its dimensions are chosen and which categories are mapped to which locations).
In our opinion, the article makes three main contributions:
-
Explain the scientific metrics used in multiple domains in a unifying framework:
Various scientific measures (e.g., common metrics for quantifying the performance of classification tasks and clinical diagnostics, but also the effects of risks and treatments) are defined and explicated in a unifying framework. (See Section 4. Integration, especially Figure 6 and Table 3.) -
Clarify theoretical debates on facilitation effects in tasks of Bayesian reasoning:
Expressing probabilistic problems in terms of natural frequencies or the so-called short menu format are known to facilitate the correct solution to problems that ask for the inverse of a conditional probability (e.g., Gigerenzer & Hoffrage, 1995, see Table 1). Whereas most accounts focus on the difference between probability vs. frequency formats, we provide a representational explanation of these effects (based on structural aspects of the 2×2 matrix) and explore related topics (e.g. the mechanisms implicitly assumed by nested sets theory and how visualizations can help to render problems more transparent (see Section 5.1. Perspectives on Natural Frequencies and Nested Sets). -
Provide a non-circular and non-trivial definition of representational transparency:
- A representation is transparent with respect to a specific task when it explicates the perspective required for solving the task.
When applying this definition to measures derived from a 2×2 matrix, we obtain:
- A particular measure’s representation is transparent when it explicates the perspective adopted during the measure’s derivation.
(See Section 2.4. Presenting for details.)
- A representation is transparent with respect to a specific task when it explicates the perspective required for solving the task.
Apart from these main contributions, the paper makes some additional points:
- The research traditions on problem solving and thinking and reasoning suffer from serious issues (see Section 1. Introduction). In contrast to overly narrow or too vague accounts and a tendency to depict representational isomorphs as a source of biases or problems, we advocate a notion of positive framing effects: Starting from a shared representation has the potential of illuminating and linking a wide array of measures, problems, and semantic domains.
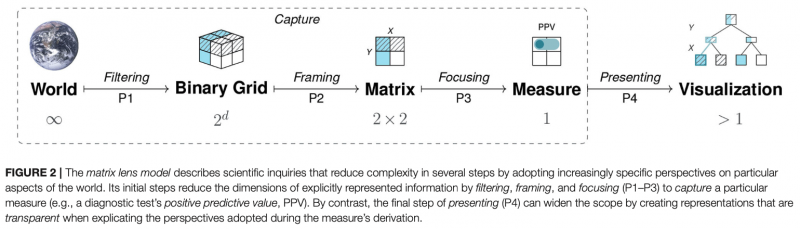
- The matrix lens model (see Section 2. The Matrix Lens Model and the pipeline of perspectives shown in Figure 2) describes how scientific measures (e.g., a diagnostic test’s positive predictive value, PPV) are captured in three steps:
- filtering the world into a binary grid of frequency counts,
- framing a 2×2 matrix (aka. contingency table), and
- focusing on particular aspects (e.g., dividing a cell frequency by the sum of its row to obtain a conditional probability).
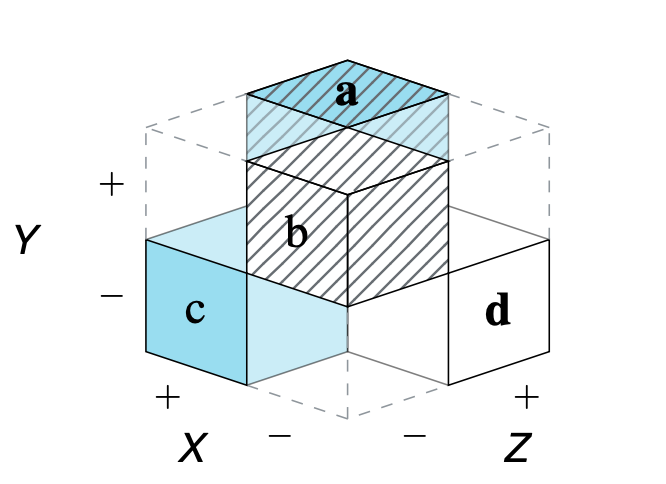
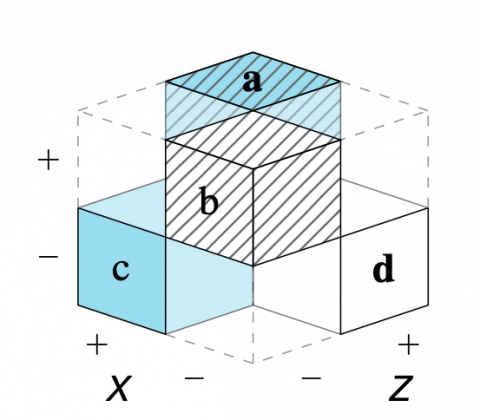
- The partial cube model (see Figure 5) depicts a special case in which many category combinations are excluded for semantic reasons. It shows that Bayesian situations are three-dimensional and give rise to three distinct 2×2 matrices and six hierarchical trees. (Section 1 of the Supplementary Material further shows how each level allows for the same 24 distinct perspectives.)
- Section 5.2. Perspectives on Bayesian Brain Teasers provides matrix-based perspectives on some notorious puzzles. We explicate the so-called cab problem (see Figure 9) and the Monty Hall problem (see Figure 10). Our structural analysis shows their similarities to other Bayesian tasks, but also illustrate that the typical responses can arise in multiple ways.
- The initial steps of the matrix lens model are illustrated by the population of passengers on the Titanic. Later (see Section 5.3. Perspectives on Surviving the Titanic), we address the question whether the ship’s evacuation protocol successfully implemented the so-called Birkenhead drill (i.e., preferential treatment of women and children). Interestingly, the question “Were women and children more likely to survive the disaster than adult men?” can be answered in multiple and conflicting ways (see Figure 11). This illustrates how the conclusions drawn from data depend on the particular perspective adopted and the chosen measure.
As you can see, the range of tasks and problems discussed in this paper really is quite wide. However, the sweeping over a variety of concepts and topics makes sense when anchoring them in a shared representational construct (i.e., the 2×2 matrix).
Overall, we hope that this paper contributes to several theoretical discussions and enables new insights. But rather than taking our word for it, just check out the article for yourself.
Keywords
- 2×2 matrix, contingency table, confusion matrix, framing effects, representational isomorphs, matrix lens model, partial cube model, Bayesian reasoning, conditional probability, natural frequencies, nested-set theory, problem solving, risk literacy, scientific measurement, clinical diagnostics, insight, transparency, visualization.
Reference
- Neth, H., Gradwohl, N., Streeb, D., Keim, D.A., & Gaissmaier, W. (2021). Perspectives on the 2×2 matrix: Solving semantically distinct problems based on a shared structure of binary contingencies. Frontiers in Psychology, 11, 567817. doi: 10.3389/fpsyg.2020.567817
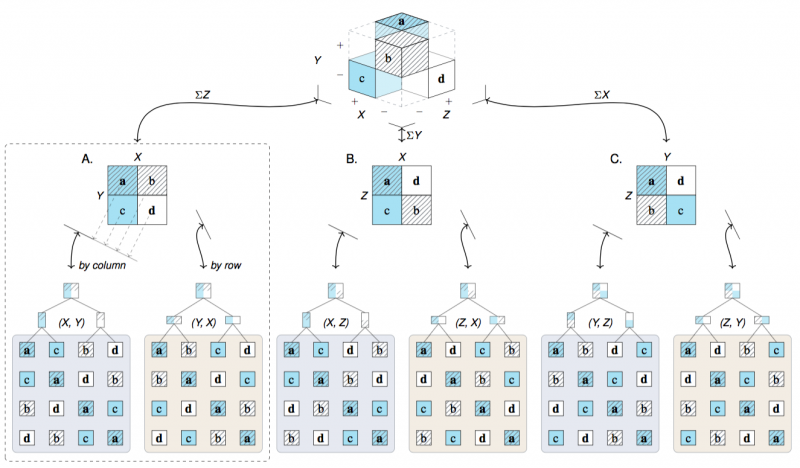
Projections of a partial cube model (from 3D) into three 2×2 matrices (2D) and six hierarchical trees or linear 1D sequences. Each level of representation supports the same 24 arrangements of the four elementary cells (see the Supplementary Material for details).
Related: riskyr: Rendering risk literacy more transparent
Resources: Open access | PDF | Google Scholar
Comments are Disabled