
riskyr: A toolbox for rendering risk literacy more transparent
so as to make the solution transparent.
Hansjörg Neth, Felix Gaisbauer, Nico Gradwohl, Wolfgang Gaissmaier
riskyr: A toolbox for rendering risk literacy more transparent
Abstract: Risk-related information — like the prevalence of conditions and the sensitivity and specificity of diagnostic tests or treatment decisions — can be expressed in terms of probabilities or frequencies. By providing a toolbox of methods and metrics, the R package riskyr computes, translates, and displays risk-related information in a variety of ways. Offering multiple complementary perspectives on the interplay between key parameters renders teaching and training of risk literacy more transparent.
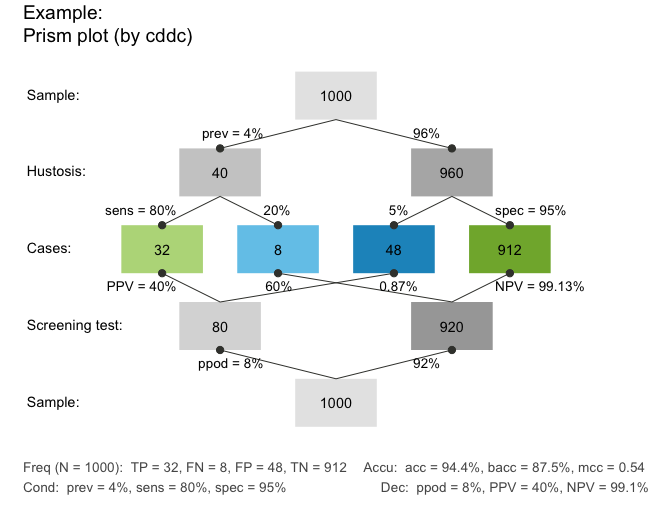
Example of a riskyr prism plot.
The goals of riskyr are less of a computational and more of a representational nature, by addressing the expression in and translation between different formats of risk-related information. Whereas people find it difficult to understand and compute information expressed in terms of probabilities, the same information is easier to understand and compute when expressed in terms of frequencies. But rather than just expressing probabilities in terms of frequencies, riskyr allows translating between formats and illustrates the relationships between different representations in a variety of ways. Switching between and interacting with different representations fosters transparency and boosts human understanding of risk-related information.
Basic assumptions and goals driving the current development of riskyr include:
- Effective training in risk literacy requires transparent representations, smart strategies, and simple tools.
- We aim for a set of (computational and representational) tools that facilitate various calculations, translations between formats, and a range of alternative views on the interplay between probabilities and frequencies.
- A variety of visualizations that illustrate the interplay of parameters and metrics facilitate active and explorative learning. It is particularly helpful to view relationships from alternative perspectives and to observe the change of one parameter as a function of others.
Based on these assumptions and goals, we provide a range of computational and representational tools. Importantly, the objects and functions in the riskyr toolbox are not isolated, but complement, explain, and support each other. All functions and visualizations can also be used separately and explored interactively, providing immediate feedback on the effect of changes in parameter values. By providing a variety of customization options, users can explore and design representations of risk-related information that suit their personal needs and goals.
Summary: We introduce the R package riskyr, which computes, translates, and displays risk-related information in a variety of ways. Offering multiple complementary perspectives on the interplay between key parameters renders teaching and training of risk literacy more transparent.
Keywords: Risk literacy, risk perception, Bayesian situations, probabilities, natural frequencies, visualization.
Reference: Neth, H., Gaisbauer, F., Gradwohl, N., & Gaissmaier, W. (2018). riskyr: A toolbox for rendering risk literacy more transparent. Social Psychology and Decision Sciences, University of Konstanz, Germany. Computer software (R package version 0.1.0, Feb. 19, 2018). Retrieved from https://CRAN.R-project.org/package=riskyr.
Related: Perspectives on the 2×2 matrix | FFTrees | Heuristics: Tools for uncertainty | Homo heuristicus in the financial world
Examples: The following visualizations are generated by riskyr:
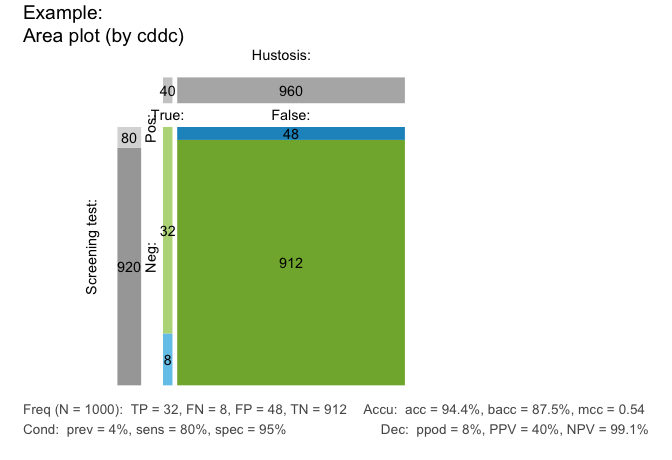
Example of a riskyr area plot (or mosaic diagram).
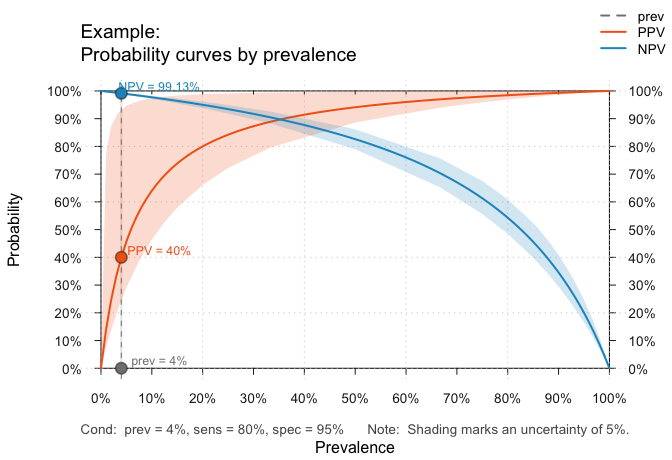
Example of a riskyr curve plot.
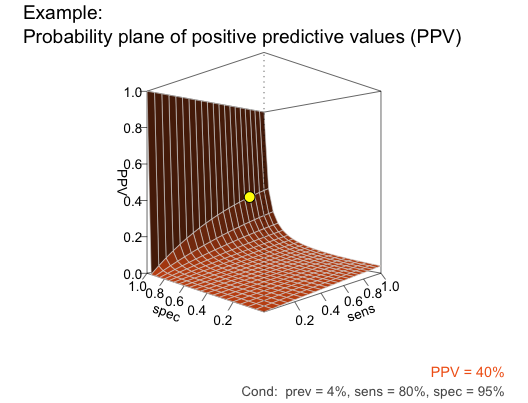
Example of a riskyr plane plot.
Related resources:
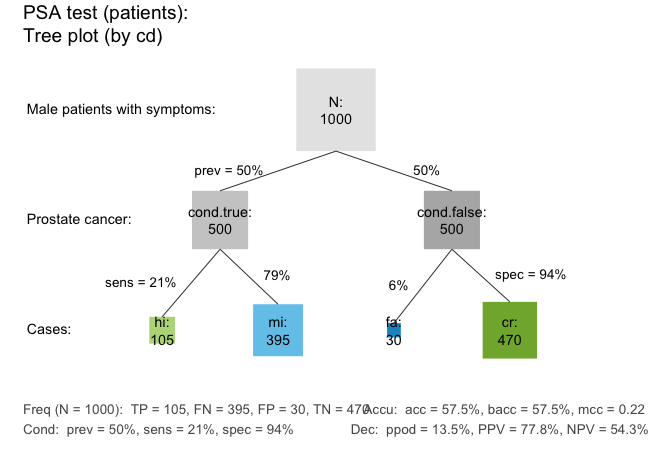
Example of a riskyr prism plot (or frequency tree diagram).
- Release version: https://CRAN.R-project.org/package=riskyr
- Development version: https://github.com/hneth/riskyr/
- Interactive online version: http://riskyr.org
- Documentation online: https://hneth.github.io/riskyr/
Comments are Disabled